

A poverty estimate can rise when statisticians obtain better information about a year that has already passed. The World Bank’s June 2025 revision is a useful case: it changed both the international comparison standard and the information used to estimate household welfare. Reading the revised number as a sudden deterioration in living conditions would confuse a statistical update with an event.
The Bank’s explanation of the revision replaced the $2.15 international line expressed in 2017 purchasing-power terms with a $3 line in 2021 terms. Purchasing power parity adjusts for differences in prices across economies. The figures are not directly comparable cash amounts converted at the market exchange rate.
This article examines that documented revision. It does not present the June 2025 release as the latest count of people living in poverty.
Keep the reference year and release date separate
The factsheet reported about 838 million people in extreme poverty in 2022, compared with a previously reported estimate of 713 million for that same year. The difference was a revision to knowledge about 2022, not a count of people who entered poverty between the two publication dates.
The Bank attributed the change to new purchasing-power data, revised poverty thresholds and household survey updates. Those components can move estimates in different directions. Treating the total revision as the effect of just one component would require a separate decomposition.
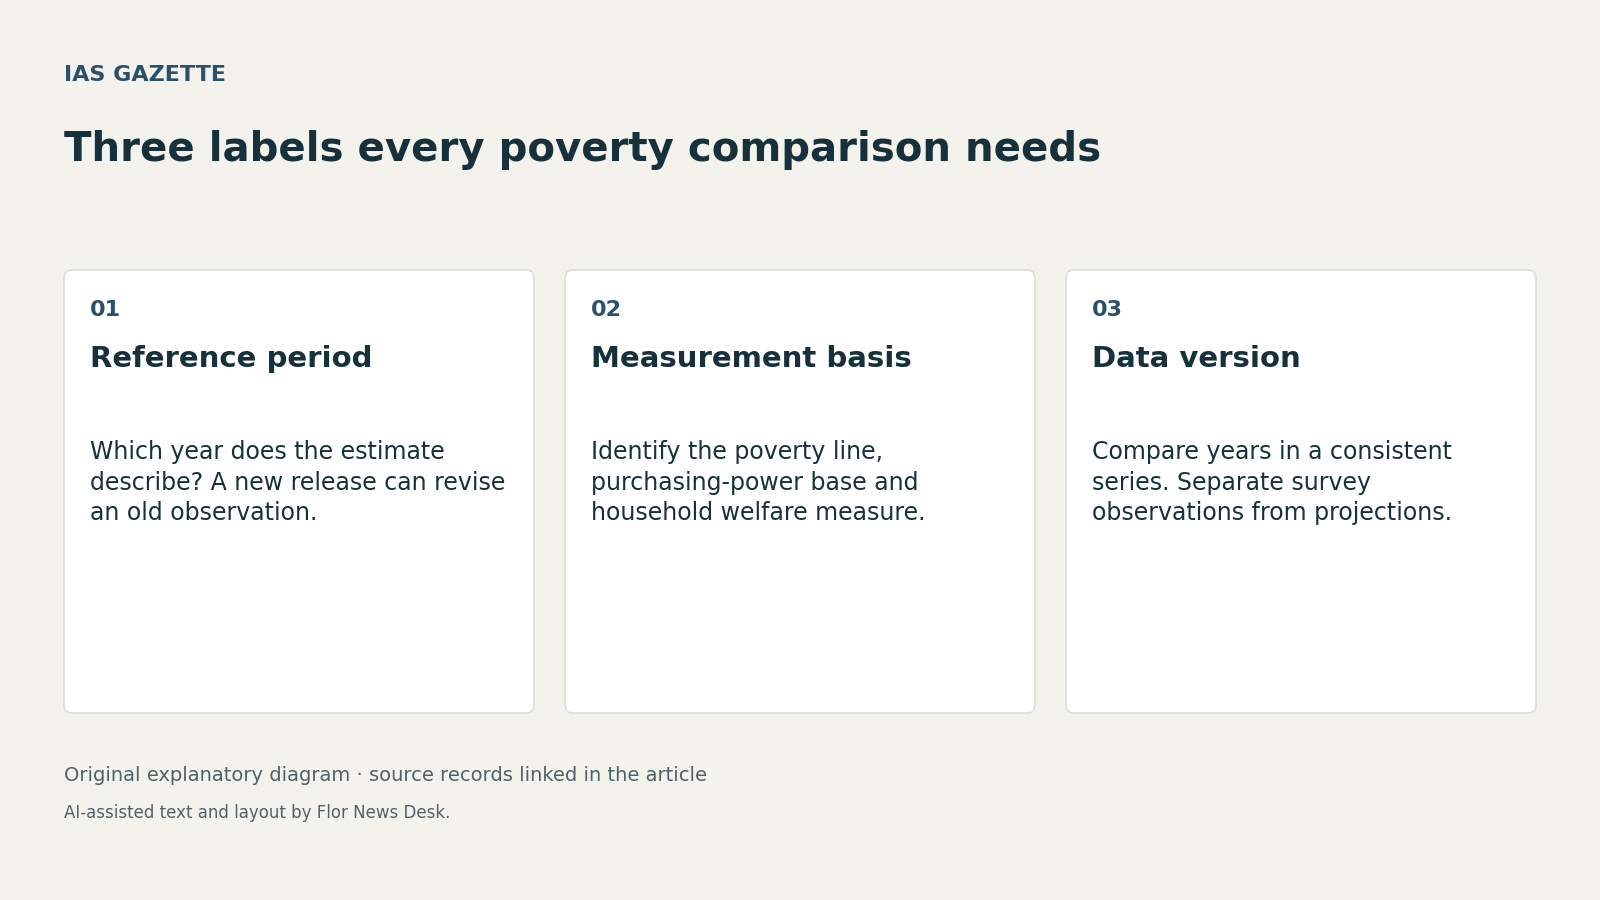
A clear chart therefore needs two labels: the period the estimate describes and the version of the data used. Without both, a reader may mistake a newer publication date for a newer observation.
Survey design can change what is measured
The accompanying technical note documents the introduction of new Indian survey data and adjustments to the existing series for comparability. It distinguishes survey information from projections and describes changes to welfare measures, prices and coverage.
The broader interpretation is straightforward. A survey that captures a household expense previously missed can change measured consumption without that household having changed its behaviour. Comparability requires understanding how the earlier and later observations were constructed.
This does not make the revision arbitrary. Publishing the methods allows researchers to identify what changed and assess whether a claimed trend survives a consistent comparison. It also allows a disagreement about measurement to be separated from a disagreement about policy.
Use a consistent series for a policy claim
Suppose a hypothetical report quotes a poverty rate of 20 percent for an earlier year from one database edition and 15 percent for a later year from another. The five-point difference mixes two questions: how conditions changed and how measurement changed.
A stronger comparison would retrieve both years from the same documented series, check any comparability flags and identify the underlying survey dates. If an observation is a projection, the report should say so. A national policy assessment should also consider the national poverty standard, whose role the Bank distinguishes from international benchmarking.
No single count describes every form of deprivation. For a reader assessing a government’s record, the immediate task is narrower: establish that the two numbers refer to comparable people, concepts and periods before attributing their difference to a policy.
The revision is valuable precisely because it improves the record. Its usefulness depends on preserving that record’s dates, definitions and limitations when the figures enter public debate.
Read our editorial standards or send a correction to the editorial desk.